Q3 2022 Gold Demand Trends
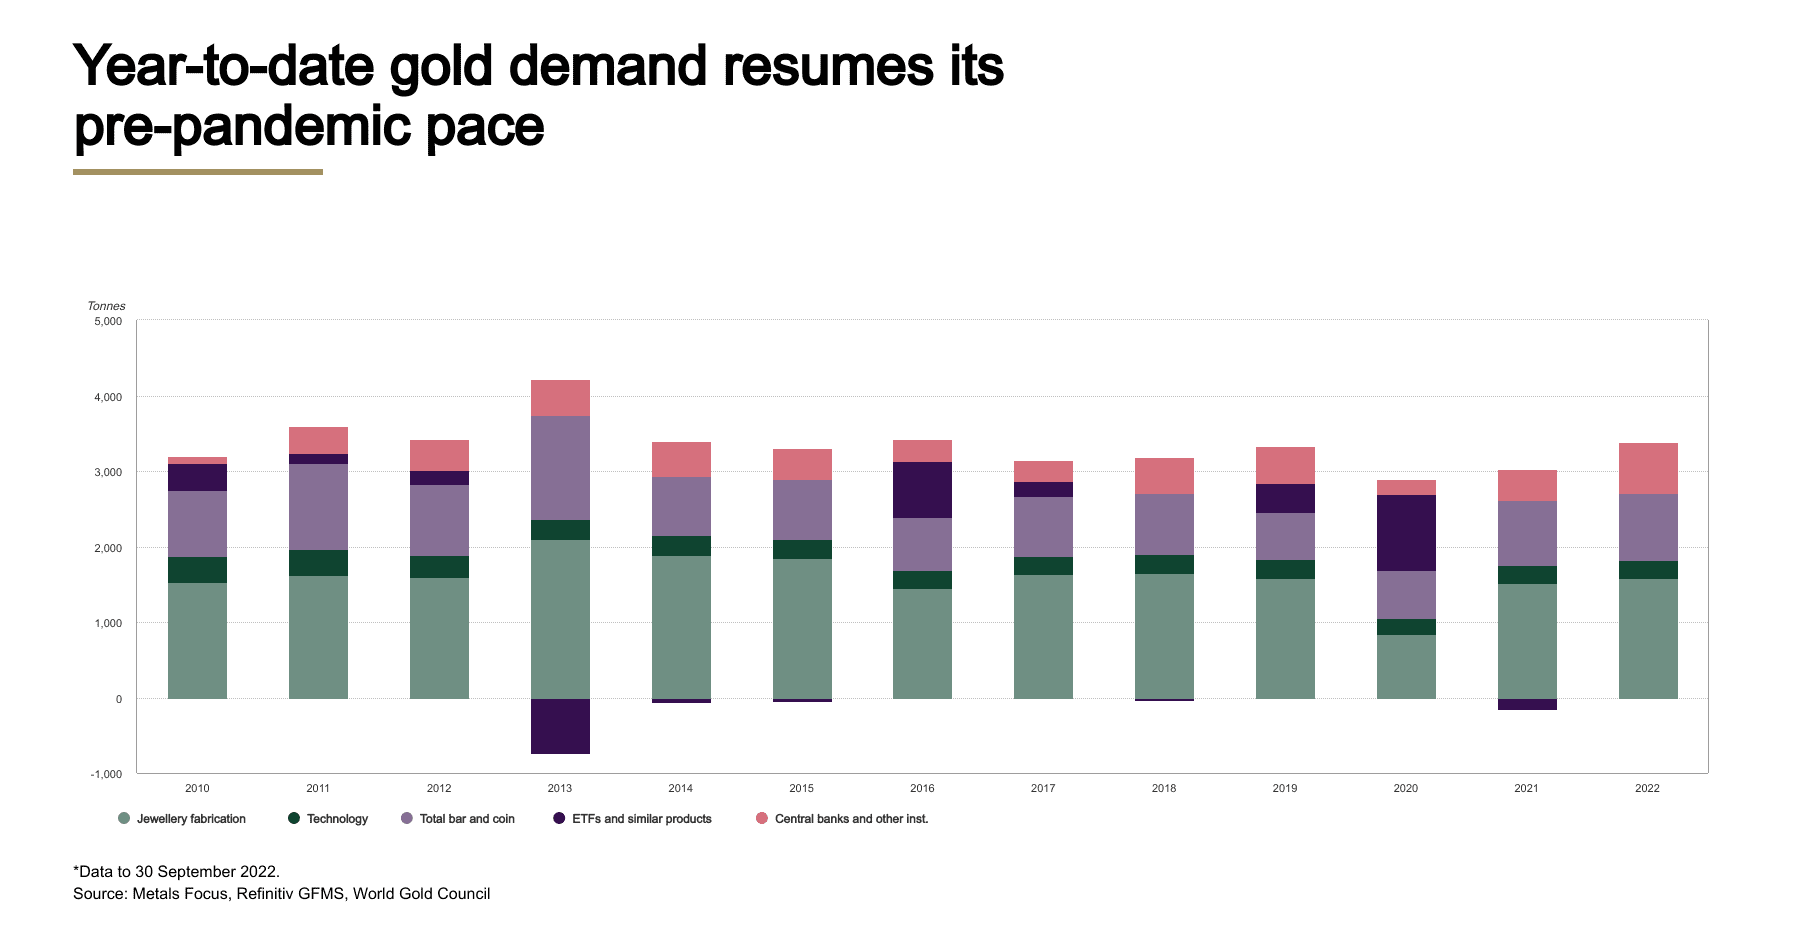
According to the World Gold Council’s quarterly report, demand for gold (excluding OTC) in Q3 increased by 28% year over year (y-o-y) at 1,181t. Demand grew 18% year-to-date (y-t-d) compared to the same period in 2021, reaching pre-pandemic levels.
In the third quarter, the LBMA gold price PM (US$/oz) decreased by 8%. The strength of the US dollar to rise interest rates by the Fed to combat high inflation, is the main reason caused the fall. Although the average gold price fell 3% y-o-y in Q3, it was nevertheless in line with the relative performance of supply and demand (including OTC) during the quarter.
Investment Trends
- Investment in bars and coins increased, while gold ETFs experienced outflows for a second consecutive quarter.
- Global gold-backed ETFs saw the largest outflows since Q2 2013, of 227t in Q3 as investors focused on increasing rates and a stronger US dollar.
- Flows into gold ETFs were virtually flat during the year to the end of September, having almost completely reversed the inflows from January to April.
- The bar and coin sector experienced its strongest third quarter since 2011, with a very healthy 351t of demand.
Widespread, multi-decade high inflation and its impact on interest rates, dominated the investing environment for gold in Q3. Investors in bars and coins concentrated on the former and sought out gold’s security as an inflation hedge. Investors in gold ETFs, on the other hand, decreased their holdings as they concentrated on gold’s rising opportunity cost in the face of significant rate hikes from central banks globally and a surge in the US dollar. Outflows from ETFs were accompanied by a slowdown in OTC investments, and managed money futures positioning on the Comex temporarily switched to being net short for the first time in three years.
Jewellery Demand Trend
Consumption of gold jewelry worldwide returned to pre-COVID levels.
- Q3 demand benefitted from a decline in the price of gold.
- India took the lead in the rebound, with 17% y-o-y growth in demand to 146 t, the best third quarter since 2018.
- China had a slower growth, 5% y-o-y, as intermittent COVID-related restrictions impaired consumer confidence.
Central Banks
In Q3 2022 Central bank buying hits all-time quarterly record.
- Q3 net demand includes significant estimate for unreported purchases.
- The biggest reported buyers within the quarter are Turkey, Uzbekistan and Qatar.
- As a result, y-t-d net purchases have reached 673t, which surpass all annual totals since 1967.
In Q3 (+115% q-o-q), purchases by central banks worldwide increased to approximately 400t. Since 2000, this quarter’s demand from this sector has been at an all-time high, nearly double the previous record of 241t set in Q3 2018. This brings the year-to-date total to 673t, which is more than any other full year total since 1967. It also represents the eighth consecutive quarter of net purchases.
In technology sector, rapidly declining consumer confidence hits demand.
- Gold used in industrial applications decreased by 8% y-o-y to 77t, the weakest third quarter on the record.
- The electronics sector, which is the primary industrial demand for gold, fell by 9% y-o-y to 63t. During what is usually the electronics industry’s peak season, consumer demand has decreased dramatically.
In mining, total supply increased by 1% y-o-y in Q3 as decreased recycling offset increased mine production.
- Following the improvement in Chinese output and fewer technical issues elsewhere, Q3 mine production grew to almost 950t, up 2% y-o-y.
- Recycled gold supply decline 6% y-o-y, mainly due to lockdowns in China and the lack of obvious indicators of market turmoil elsewhere.
- The overall gold supply increased 3% y-o-y, on a y-t-d basis.
Regional performance
- In China demand for bars and coins nearly doubled to 70t from the previous quarter’s COVID lockdown-induced drop.
- In India retail investors reacted to lower local gold prices and weaker equities markets by increasing demand for Indian bars and coins up to 6% y-o-y increase.
- The Middle East saw the highest level of quarterly retail investment in four years with a 64% y-o-y increase to 26t. Rising inflation and the opportunity to buy on a dip in the price were the main factors driving investment during the quarter, in line with the broad global themes.
- In Q3, retail investment in Turkey increased more than fivefold, which was extraordinarily strong. It was the second-highest quarter in the report data series, with a 47t value. Demand soared as a result of record inflation and stable lira prices, and this gained pace on price pullbacks during the quarter.
- The US bar and coin investment demand remained high, increasing by 3% y-o-y at 25t. The y-t-d sales of US mint coins are the highest since 1999. As consumers express growing pessimism about the state of the US economy amid rising inflation, the importance of gold as an inflation hedge has encouraged investment demand.
- European retail gold investment increased by 28% y-o-y at 72t. The region’s slowing GDP, the threat of the war, and monetary policy makers managing a delicate balance between rising rates just enough to control inflation without tipping the region into a deep recession, has encouraged continued flows into gold. Germany’s demand increased 25% y-o-y, to a record high of 131t.