Q3 2023 Gold Demand Trends: Gold Is Outperforming the S&P 500 Index
The 2023 outlook calls for a rise in overall investment demand, including OTC, in contrast to the decreased fabrication demand resulting from higher gold prices. This year, central bank purchases have continued at an explosive rate and may surpass the record set last year. There is a good chance that mine production will reach a record yearly amount.
The best-performing precious metal for the last week of October 2023 was palladium, up 1.78%. U.S. stocks are in their third monthly decline while underwhelming corporate earnings and yields climbing above 5% have investors pondering their choices. When other assets don’t look so safe, gold may find a more welcome buyer. As of Friday afternoon, gold is up more than 10% year-to-date and the S&P 500 is now up only 7%. Russia saw gold production drop 9.2% year-on-year and 4.1% month-on-month in September 2023, the Federal State Statistics Service (Rosstat) said in a statement. Despite the declining monthly data, the overall volume of domestic gold production rose 1.7% for the first nine months of this year.
Eldorado Gold’s earnings per share (EPS) of $0.17 above the average estimate of $0.04, in part due to lower-than-anticipated expenses across the board. Pre-released third-quarter output totaling 121,000 ounces of gold showed increased production from the previous quarter, but the consolidated AISC of $1,177 per ounce was 21% less than the consensus AISC of $1,486 per ounce. Above the $0.12 consensus, Alamos announced adjusted EPS for the third quarter of $0.14. Driven by ongoing outperformance at Mulatos, production of 135,400 ounces at total cash costs of $835 per ounce and AISC (all-in sustaining costs) of $1,121 per ounce surpassed consensus by 12%, 4%, and 7%, respectively. The business reiterated its cost projection with AISC of $1,125–$1,175 per ounce and upped its production guidance for the fiscal year 2023 from 480–520,000 ounces of gold to 515–530,000 ounces of gold.
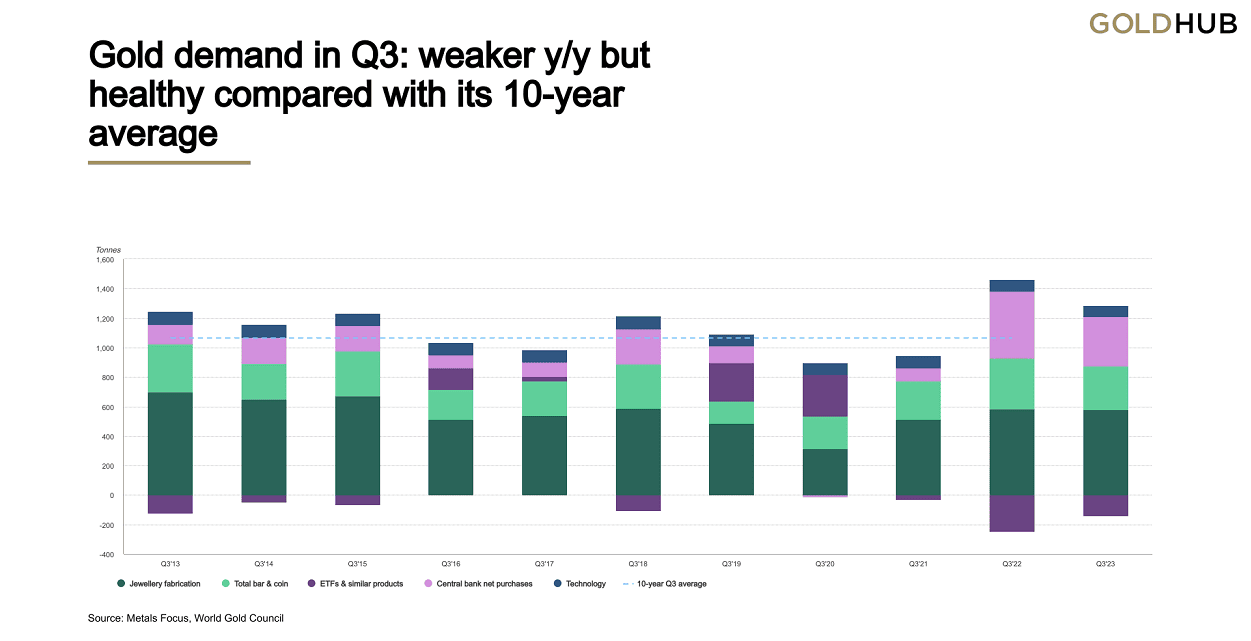
Gold demand in Q3: weaker y/y but healthy compared with its 10-year average
While still at a historic rate, central banks’ purchases of gold fell short of the record set in Q3 of 2022. The demand for jewellery decreased little despite the high price of gold, but the outlook for investments remained uncertain.
With the exception of OTC, gold demand in Q3 was 8% higher than its five-year average at 1,147t, but 6% lower year over year. With stock movements and OTC included, overall demand increased 6% year over year to 1,267t.1
The third best quarter for net central bank purchases, with 337t, was not able to surpass the remarkable 459t from Q3’22. However, demand from central banks is at a record 800t, 14% more than it was at the same time last year.
Despite being 56% higher year over year, Q3 investment demand of 157t was not as strong as its five-year average of 315t. Global gold ETFs saw a 139t loss in Q3, a far lesser outflow than Q3’22 (-244t).
Bar and coin investment fell 14% year over year to 296t, although it was still much higher than the 267t quarterly average over the previous five years. Sharp declines in Europe are mostly to blame for the y/y reduction.
In Q3, OTC investments amounted to 120t. The gold price found strong support for a large portion of Q3, despite ETF withdrawals and declining COMEX futures net longs, indicating once again this opaque source of demand.
The consumption of jewellery decreased by 2% year over year to 516t, despite the ongoing rise in the price of gold. The production of jewellery was only slightly more robust, declining 1% to 578t as a result of inventory build-up.
The demand for fragile consumer devices kept undermining the amount of gold used in technology, which decreased by 3% year over year to 75t.
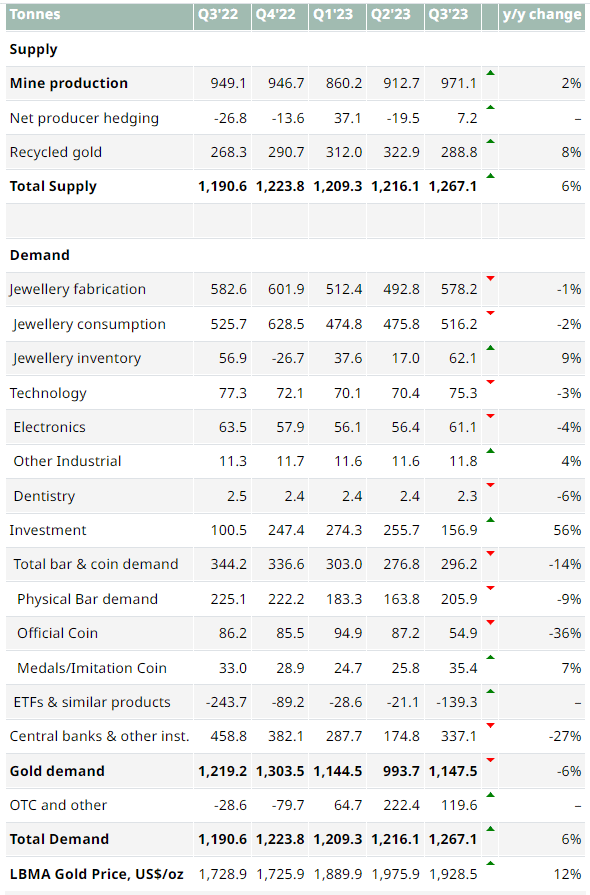
In Q3, mine output hit a record 971t, contributing to the overall increase in gold supply to 1,267t (+6% y/y). Recycling increased 8% to 289t year over year.
Highlights
In Q3, the average price of gold on the LBMA (PM) was US$1,928.5/oz. 12% higher year over year, although being 2% behind the record high observed in Q2. Due to their currencies’ weakening relative to the US dollar, several jurisdictions, namely China, Turkey, and Japan, witnessed an increase in their local gold prices.
Year to Date, net central bank gold purchases are 14% ahead of 2022. The amount of gold that central banks have purchased so far this year—800t net—is the biggest amount ever for those nine months. There is a core group of devoted, consistent purchasers, but the countries whose central banks have increased their reserves in recent quarters are diverse.
There is a mixed demand for investments. Because of the H1 strength in the Middle East, Turkey, and China, bar and coin investment is about in line with Q1–Q3 of last year. In contrast, gold ETFs have had 189t of withdrawals so far this year, and they have now experienced six consecutive quarters of negative demand.
Mine output also hit a new y-t-d high of 2,744t following a record-breaking Q3. This means that a new yearly high can be attained in 2023. With 924t (+9%), the y-t-d supply of recycled gold is likewise higher. While high gold prices have helped this supply factor, the US economy’s resiliency and the Middle East’s compelling investment appeal have limited it.
Principal points
Year to Date, net central bank gold purchases are 14% ahead of 2022. This year’s Q1–Q3 saw central banks purchase 800t of gold, the most ever for those nine months.
In Q3, jewellery consumption decreased 2% year over year to 516 trillion pieces. The y/y fall was mostly caused by the high price of gold and the state of economic uncertainty, especially in some of the more price-sensitive countries in Asia and the Middle East.
Despite being 56% higher year over year, Q3 investment demand of 157t was not as strong as its five-year average of 315t. Global gold ETFs saw a 139t loss in Q3, a far lesser withdrawal than Q3’22 (-244t). Due to significant declines in Europe, bar and coin investments were 14% worse year over year, but they are still stable over the long run.
Mine output also hit a new y-t-d high of 2,744t following a record-breaking Q3. This means that a new yearly high can be attained in 2023.
You are welcome to contact us for any additional information.